Channel flow (LES)
Case directory
$FOAM_TUTORIALS/incompressible/pimpleFoam/channel395
Summary
We calculate the channel flow from 0 sec to 1000 sec.
A rectangular analysis area is considered, with the velocity fixed at (0, 0, 0) m/s in the region "topWall" (Y-maximum surface) and "bottomWall" (Y-minimum surface), and periodic boundaries in the other regions. The LES (eddy viscosity model is WALE model) is used for turbulence calculations. The momentum is given to the entire area so that the mean velocity is (0.1335, 0, 0) m/s. This setting is specified in the file constant/fvOptions as follows.
momentumSource
{
    type            meanVelocityForce;
    active          yes;

    meanVelocityForceCoeffs
    {
        selectionMode all;

        fields (U);
        Ubar (0.1335 0 0);
    }
}
The meshes are as follows, and the number of mesh is 60000.
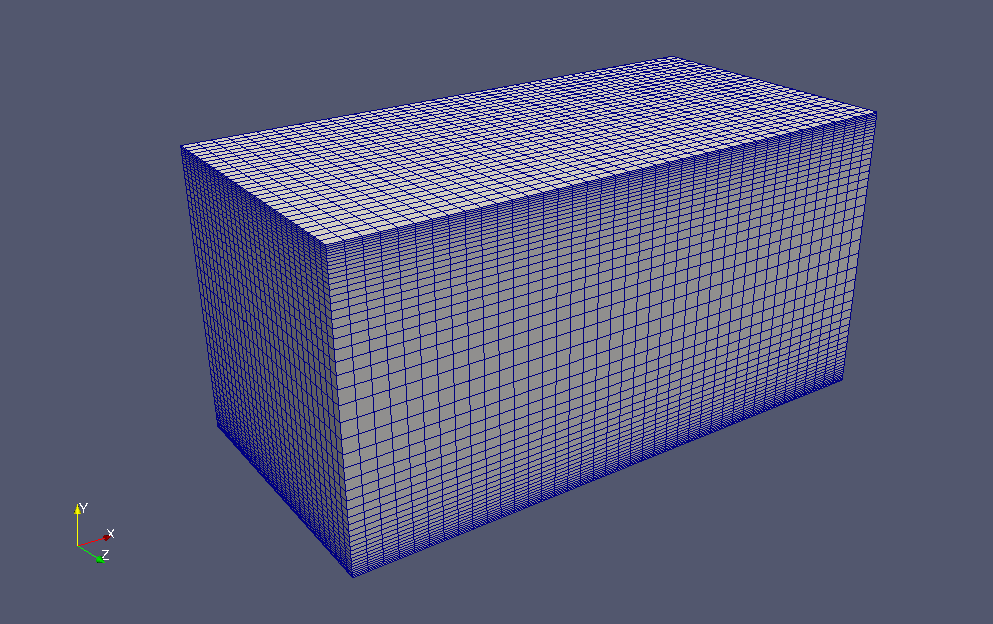 Meshes
To visualize the calculated flow velocity and pressure, check "U" and "p" in the "Properties" tab on ParaView.
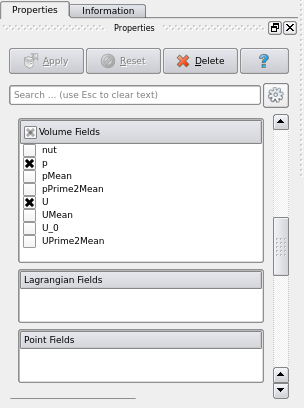 check "U" and "p"
The calculation result is as follows.
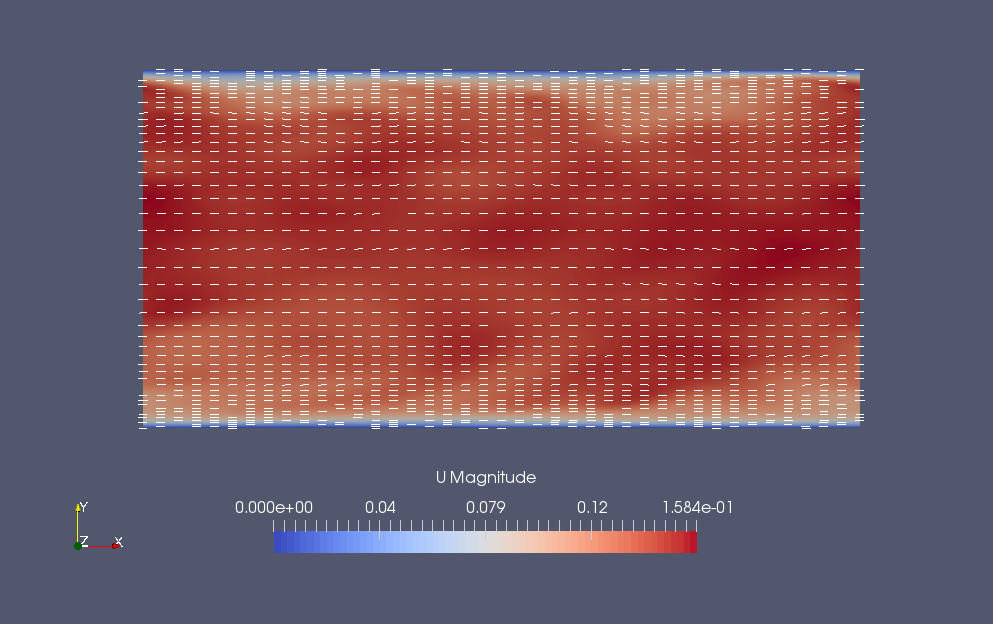 Flow velocity at final time (U)
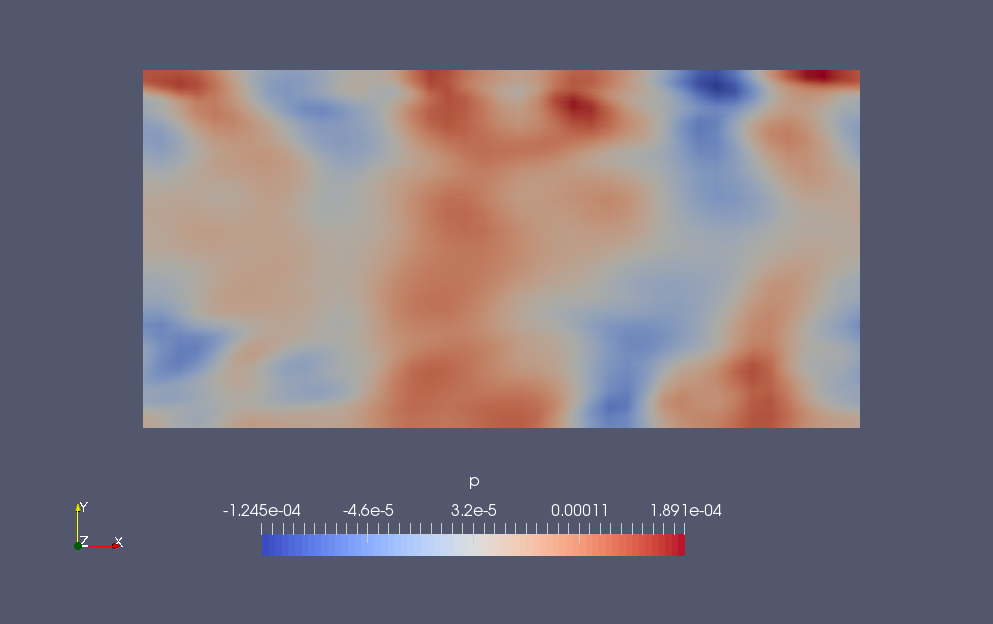 Pressure at final time (p)
After the calculation, We calculate the flow distribution in the Y-axis direction using the utility "postChannel". The settings for the calculation are specified in the file constant/postChannelDict as follows. The calculation results are saved in the directory "graphs" for each time.
patches         ( bottomWall );
component       y;
symmetric       true;
The result data is saved as text and can be graphed using any spreadsheet software.
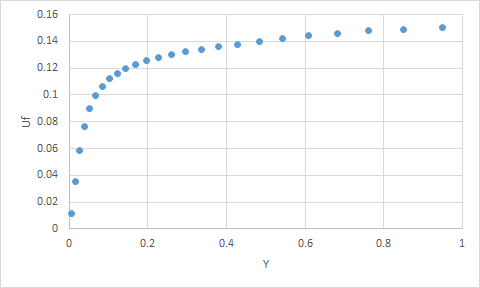 Y vs. Uf at final time
Commands
cd channel395
blockMesh
decomposePar -cellDist
mpirun -np 4 pimpleFoam -parallel
reconstructPar
postChannel
# 3D visualization
paraFoam
# Drawing graphs of postChannel results
gnuplot
gnuplot> plot "graphs/1000/Uf.xy"
We use "paraFoam" for 3D visualization and "gnuplot" for drawing graphs of postChannel results.
Calculation time
12 minutes 57.06 seconds. *4 parallel, Inter(R) Core(TM) i7-2600 CPU @ 3.40GHz 3.40GHz