Stress analysis of a flat plate with holes
Case directory
$FOAM_TUTORIALS/stressAnalysis/solidDisplacementFoam/plateHole
Summary
This is a stress analysis of a loaded flat plate with a circular hole. Only the upper right quarter is modeled and we use symmetry conditions to estimate the overall deformation. We will set (10000, 0, 0) Pa for region right and (0, 0, 0) Pa for region up and region hole. Symmetry conditions will be set for region left and region down, and the calculation is performed as a two-dimensional problem with a single mesh in the Z direction.
 Model geometry
After the calculation, the values on the region left are sampled to create a graph of the XX component of the stress. The sampling settings are specified in the file system/singleGraph as follows.
singleGraph
{
    start   (0 0.5 0.25);
    end     (0   2 0.25);
    fields  (sigmaxx);

    #includeEtc "caseDicts/postProcessing/graphs/sampleDict.cfg"

    setConfig
    {
        axis    y;
    }

    // Must be last entry
    #includeEtc "caseDicts/postProcessing/graphs/graph.cfg"
}
The meshes are as follows, and the number of mesh is 1000.
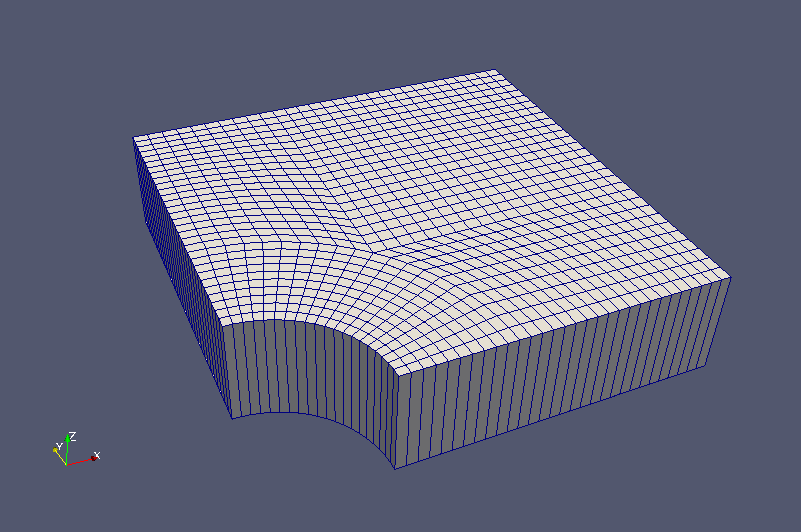 Meshes
The calculation result is as follows.
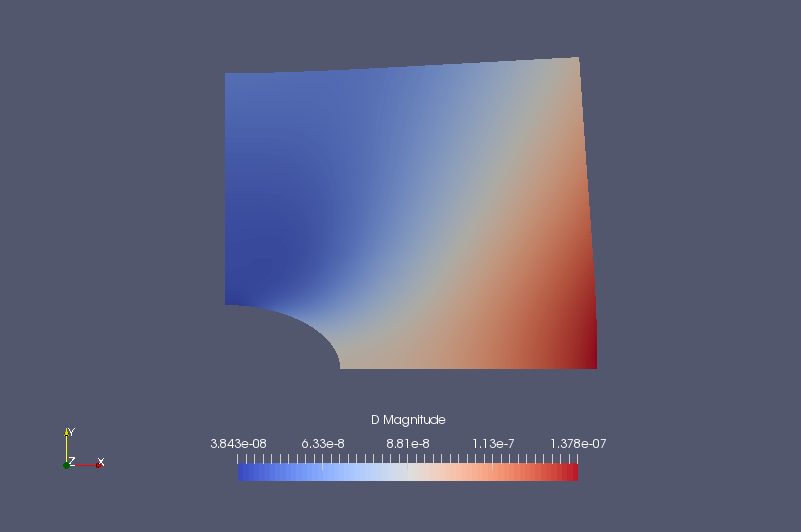 Displacement (D, multiplied by 2.5 million times and reflected in the shape)
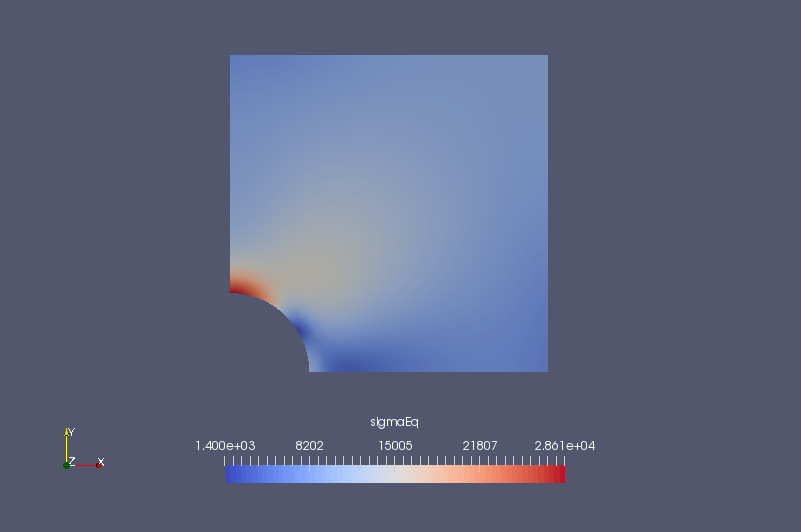 von Mises stress (sigmaEq)
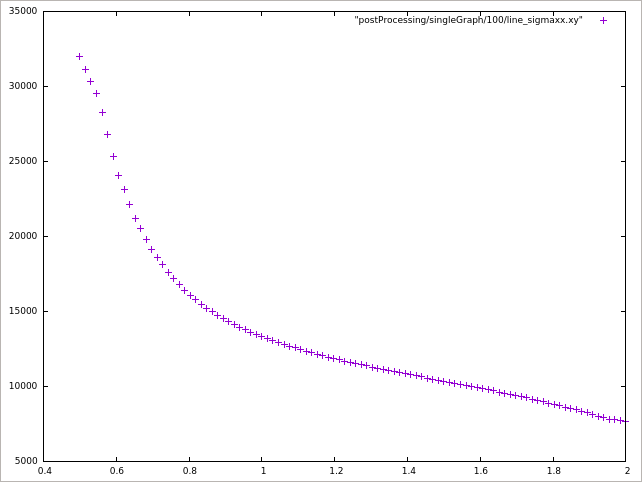 Relationship between the Y-coordinate and the stress XX component on the region left (sigmaxx)
Commands
cd plateHole
blockMesh
solidDisplacementFoam
postProcess -func "components(sigma)"
postProcess -func singleGraph
paraFoam
gnuplot
gnuplot>plot "postProcessing/singleGraph/100/line_sigmaxx.xy"
Calculation time
0.2 seconds *Single, Inter(R) Core(TM) i7-2600 CPU @ 3.40GHz 3.40GHz
Reference
- OpenFOAM User Guide: 2.2 Stress analysis of plate with hole
- SolidDisplacementFoam - CFD Online Discussion Forums
- Stress Analyzes, sigmaEq and Von Mises - CFD Online Discussion Forums